Our curated insights on customer experience
Explore our thoughts on marketing strategy, data, technology and processes so you can deliver the most valuable customer experiences.
Articles & News


27th May 2025
A Framework for Personalisation at Scale
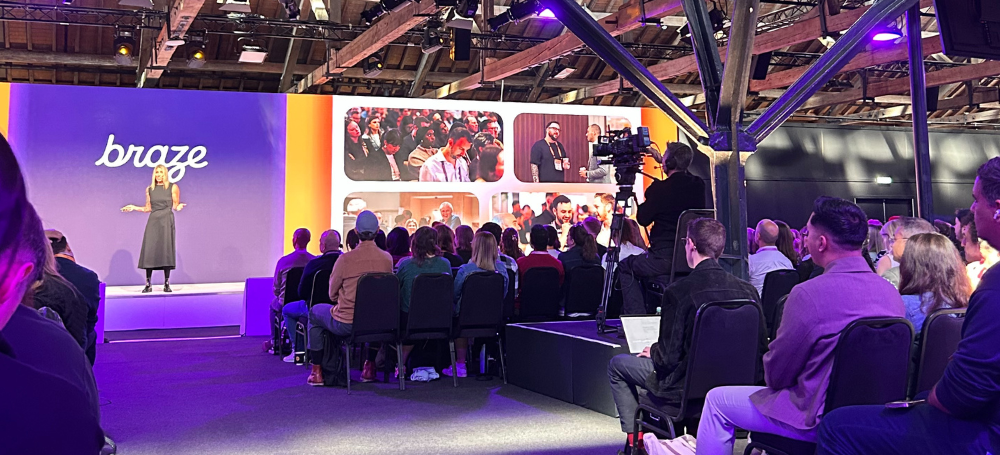
21st May 2025
Braze City x City 2025 - Our Takeaways


30th Apr 2025
Unbiased Marketing Automation Platform Comparison

8th Apr 2025
Adobe Summit 2025 Highlights - Agentic AI & More

18th Mar 2025
CDPs In Marketing: Redefining What’s Possible

22nd Jan 2025
Experience Management vs Campaign Management


22nd Jan 2025
What Do CXM Consultants Do, Exactly?

21st Jan 2025